Sicurezza & Investigazioni
Servizi professionali di Sicurezza
Siamo in possesso delle autorizzazioni e delle professionalità riconosciute dalle Prefetture per occuparci della sicurezza in Stadi, Manifestazioni Discoteche ecc
RIchiedi un preventivo
Investigazioni e Sicurezza
Investigazioni e Sicurezza


Investigazioni, Servizi di Controllo, Sicurezza Stadi Lega Pro, Security Retail, Anticendio, Formazione


Le notizie aggiornate della Global Investigation Services Srl
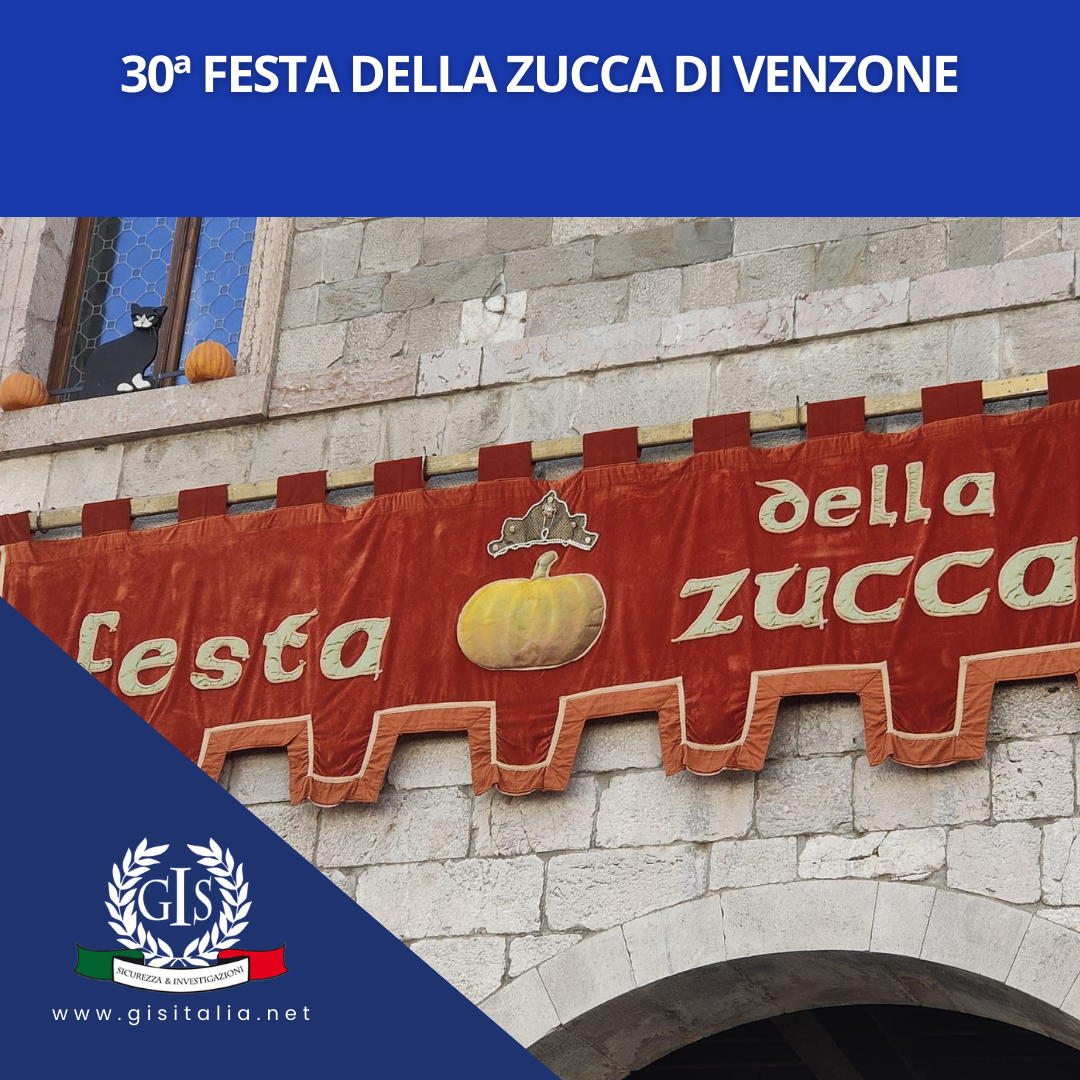
Venzone, una pittoresca cittadina del Friuli, non è solo famosa per le sue antiche mura e il suo splendido Duomo, ma anche per un curioso aneddoto legato al suo campanile. Questa particolare storia ha dato origine a una delle sagre più amate e attese della regione: la Sagra della Zucca.
Tutto iniziò quando, dopo aver costruito gran parte del Duomo, la comunità di Venzone si trovò a corto di fondi per completare il campanile. Tra vari provvedimenti straordinari per raccogliere fondi, un artista udinese fu incaricato di coronare il campanile con una splendida palla dorata. Tuttavia, al momento del pagamento, l’artista ricevette solo un terzo della somma pattuita.
Come vendetta, l’artista sostituì di nascosto la palla d’oro con una zucca, dipinta in modo così realistico da ingannare tutti. Solo quando la zucca iniziò a deteriorarsi, rivelando la sua vera natura, i cittadini compresero l’inganno.
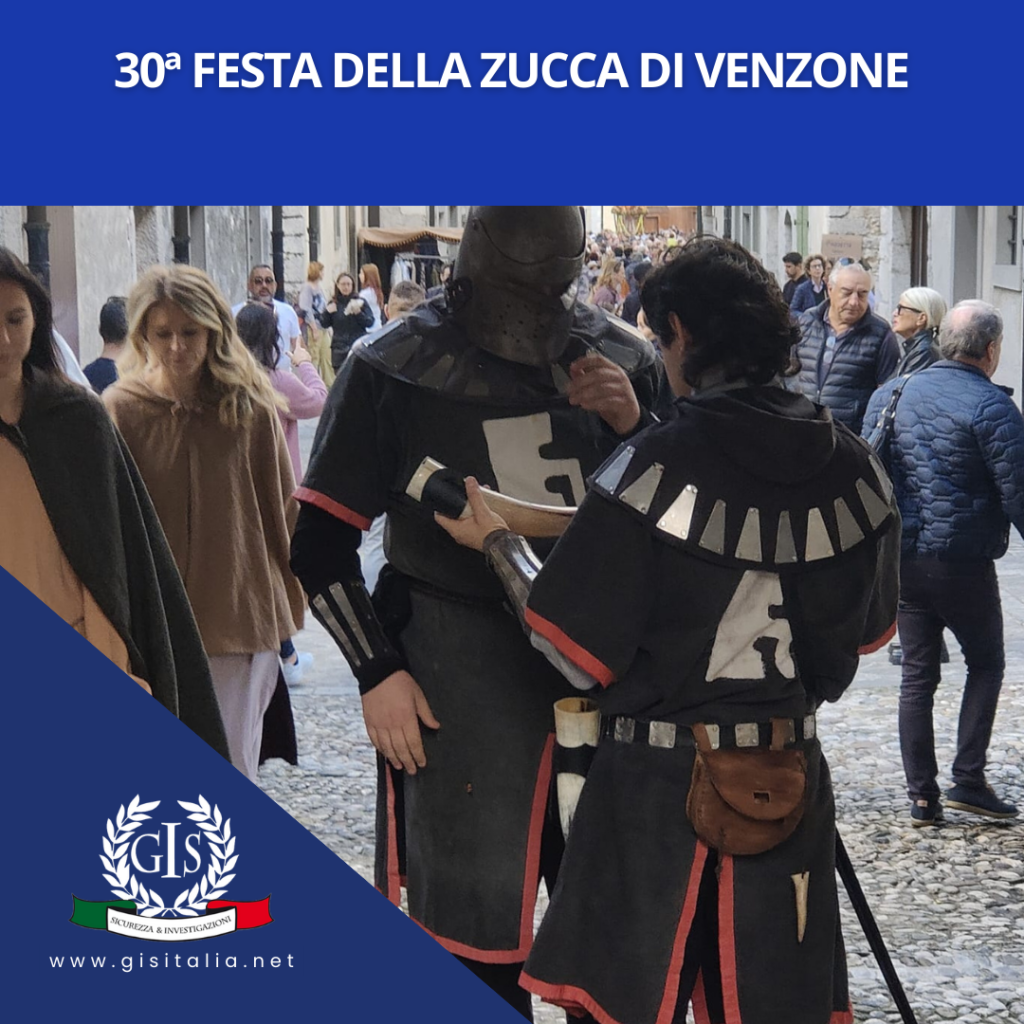
Da quel singolare episodio, Venzone ha deciso di trasformare la beffa in una celebrazione. Ogni anno, la Sagra della Zucca attira migliaia di visitatori, ansiosi di partecipare alle numerose attività legate a questo frutto autunnale. Tra bancarelle piene di delizie a base di zucca, giochi tradizionali e rappresentazioni teatrali della storica beffa, l’evento è diventato un appuntamento imperdibile.
Più che una semplice festa gastronomica, la Sagra della Zucca rappresenta un tuffo nella cultura e nella storia di Venzone. È un’occasione per riscoprire antiche tradizioni, racconti popolari e l’ospitalità calorosa della comunità locale.
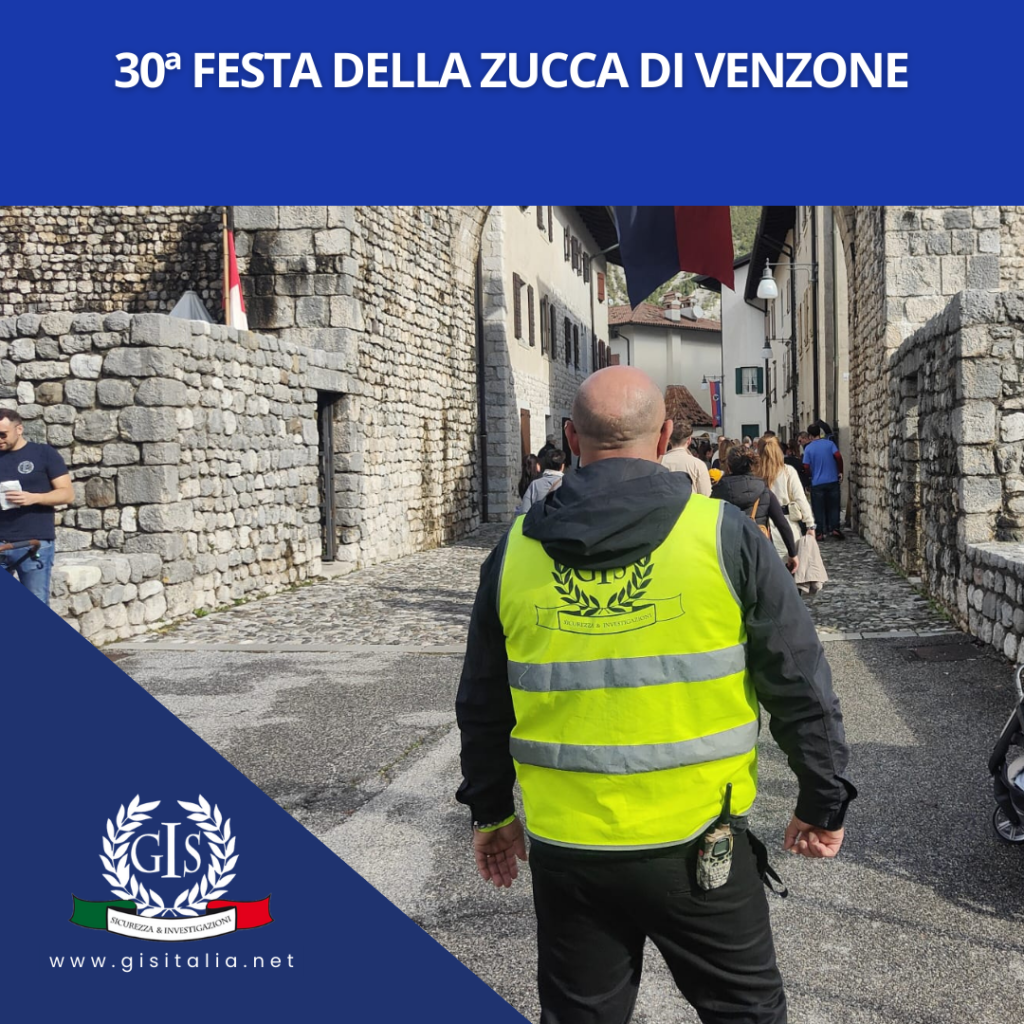
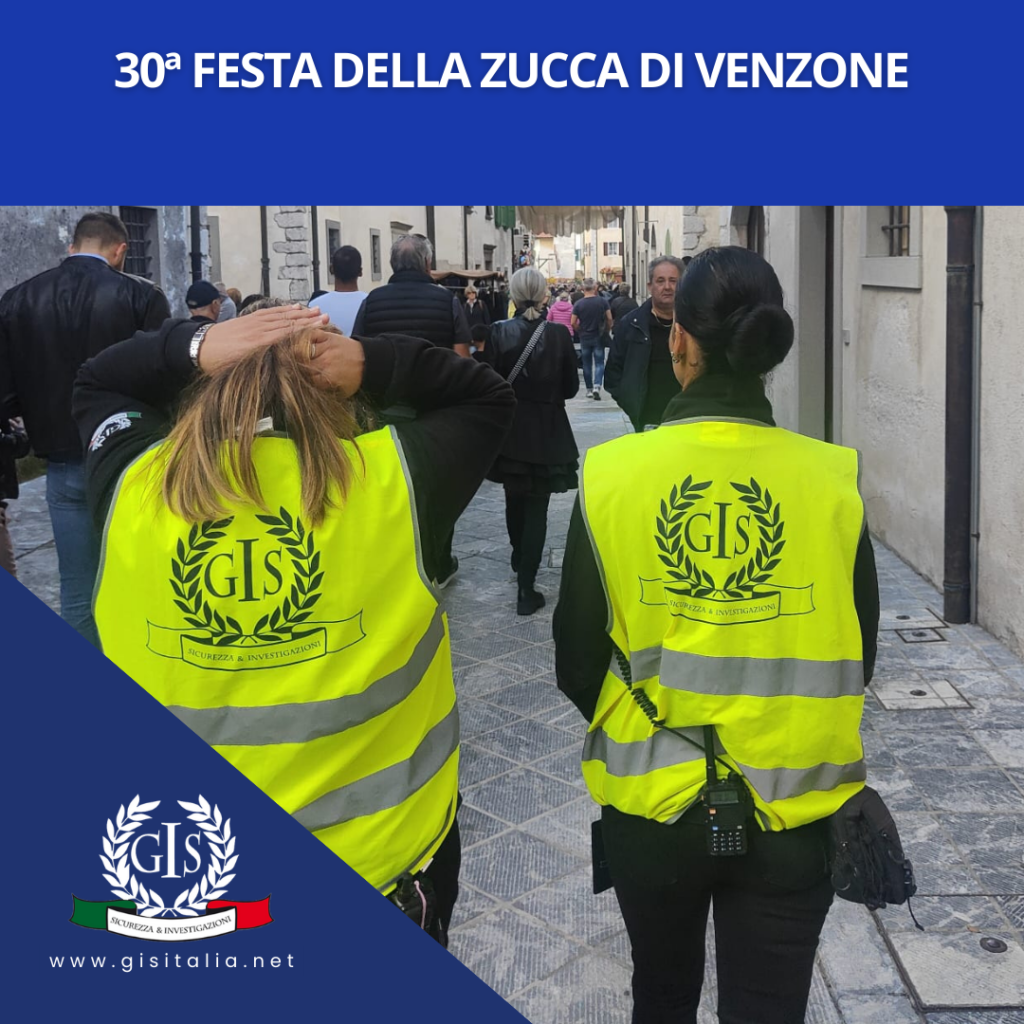
Gli Addetti ai Servizi di Controllo GIS la sicurezza dell’intera manifestazione.
Con i nostri operatori e operatrici abbiamo gestito i flussi di questo evento, durante il quale tutto è andato bene.
In conclusione, la Sagra della Zucca di Venzone è un esempio perfetto di come un singolare episodio possa dar vita a una tradizione vivace e apprezzata. Se vi trovate in Friuli durante il periodo della sagra, non perdete l’opportunità di assaporare un pezzo di storia, letteralmente! 🎃